Beyond Make or Miss: Amanda Glazer Rethinks the Statistics of Sports
SDS professor brings player-tracking data and new algorithms to pro basketball and baseball

Amanda Glazer
Amanda Glazer grew up in Davis, California, in a family that lived and breathed sports. Her father has held San Francisco 49ers season tickets since the 1970s, so fall weekends often meant an NFL game. The family also regularly went to see the Sacramento Kings and San Francisco Giants play. “I spent a lot of time going to games as a kid,” says Glazer, now a professor in UT’s Department of Statistics and Data Science. “But applying statistics to sports isn’t something I really connected the dots on or thought about until I was in grad school.”
After high school, Glazer headed east to Harvard for undergraduate studies in math and statistics. When she returned to the Bay Area for a PhD at the University of California, Berkeley, her roots as a local sports fan quickly reasserted themselves – especially after she saw an analytics role for the Giants posted to her statistics department’s listserv.
“I thought it would be so cool to work for my childhood team,” she says. Her first application went unanswered, but a year later, after a nudge through a family friend, the team called back. Soon, Glazer became the first woman ever hired by the Giants for analytics. What began as a one-season internship grew into a part-time job that lasted four and a half years.
Inside a Baseball Front Office
Glazer’s work for the Giants was multi-faceted. She started on improvements to the draft model, working on player assessments and projections of how players might improve over time. Later, she shifted to work on international players, who make up about 25% of MLB rosters and are often scouted at very young ages with limited data collection. “Projecting how a 13-year-old will perform at 20 is incredibly difficult,” she says. “There’s a lot of uncertainty there.”
Glazer also worked with Giants medical staff to project injury risk and recovery times, looking at how health problems intersect with performance. She was part of a four-person modeling team inside a research and development department of about 25 people. She found the work to be a welcome change of pace from her dissertation research, which she carried on simultaneously. “I could see things immediately having impact, and the pace was a lot faster,” Glazer says.
Glazer loved the MLB job, but she also has a passion for teaching. She sees a faculty role at a leading research university as a way to continue – and even deepen – her work at the cutting edge of high-level sports statistics. “UT turned out to be the perfect fit. I could keep doing the sports analytics work I love while also teaching,” she says. “I didn’t have to choose between the two.”
Beyond Free Throw Percentage
One of Glazer’s recent projects, a paper recently published in Scientific Reports called “A new ensemble of metrics for quantifying free-throw shooting performance using NBA player-tracking data,” gives a sense of her current research scope. It’s a collaboration with researchers in UT’s physics department and business school, drawing on the NBA’s Hawk-Eye optical tracking data, which the pro basketball league began collecting in 2023 to track players and the ball in three dimensions.
The team analyzed nearly 22,000 free throw attempts from 72 NBA players during the 2024-25 season. Instead of recording only whether the ball went in, they measured where it crossed the rim relative to an ideal spot at the center of the basket. A swish counts for more than a make that rattles in, and a near miss is treated differently from an airball. “The goal was to come up with more informative ways to evaluate shooting beyond just makes and misses,” Glazer says.
From those measurements, Glazer’s team built a metric she calls “command.” It combines two elements: how close a player’s shots land to the bullseye, and how consistent the player is from shot to shot. Command turned out to be a better predictor of future free throw percentage than free throw percentage itself. The advantage was greatest in small samples, such as when a team has only a few weeks of data. “You learn more about a player, and you learn it faster,” Glazer says.
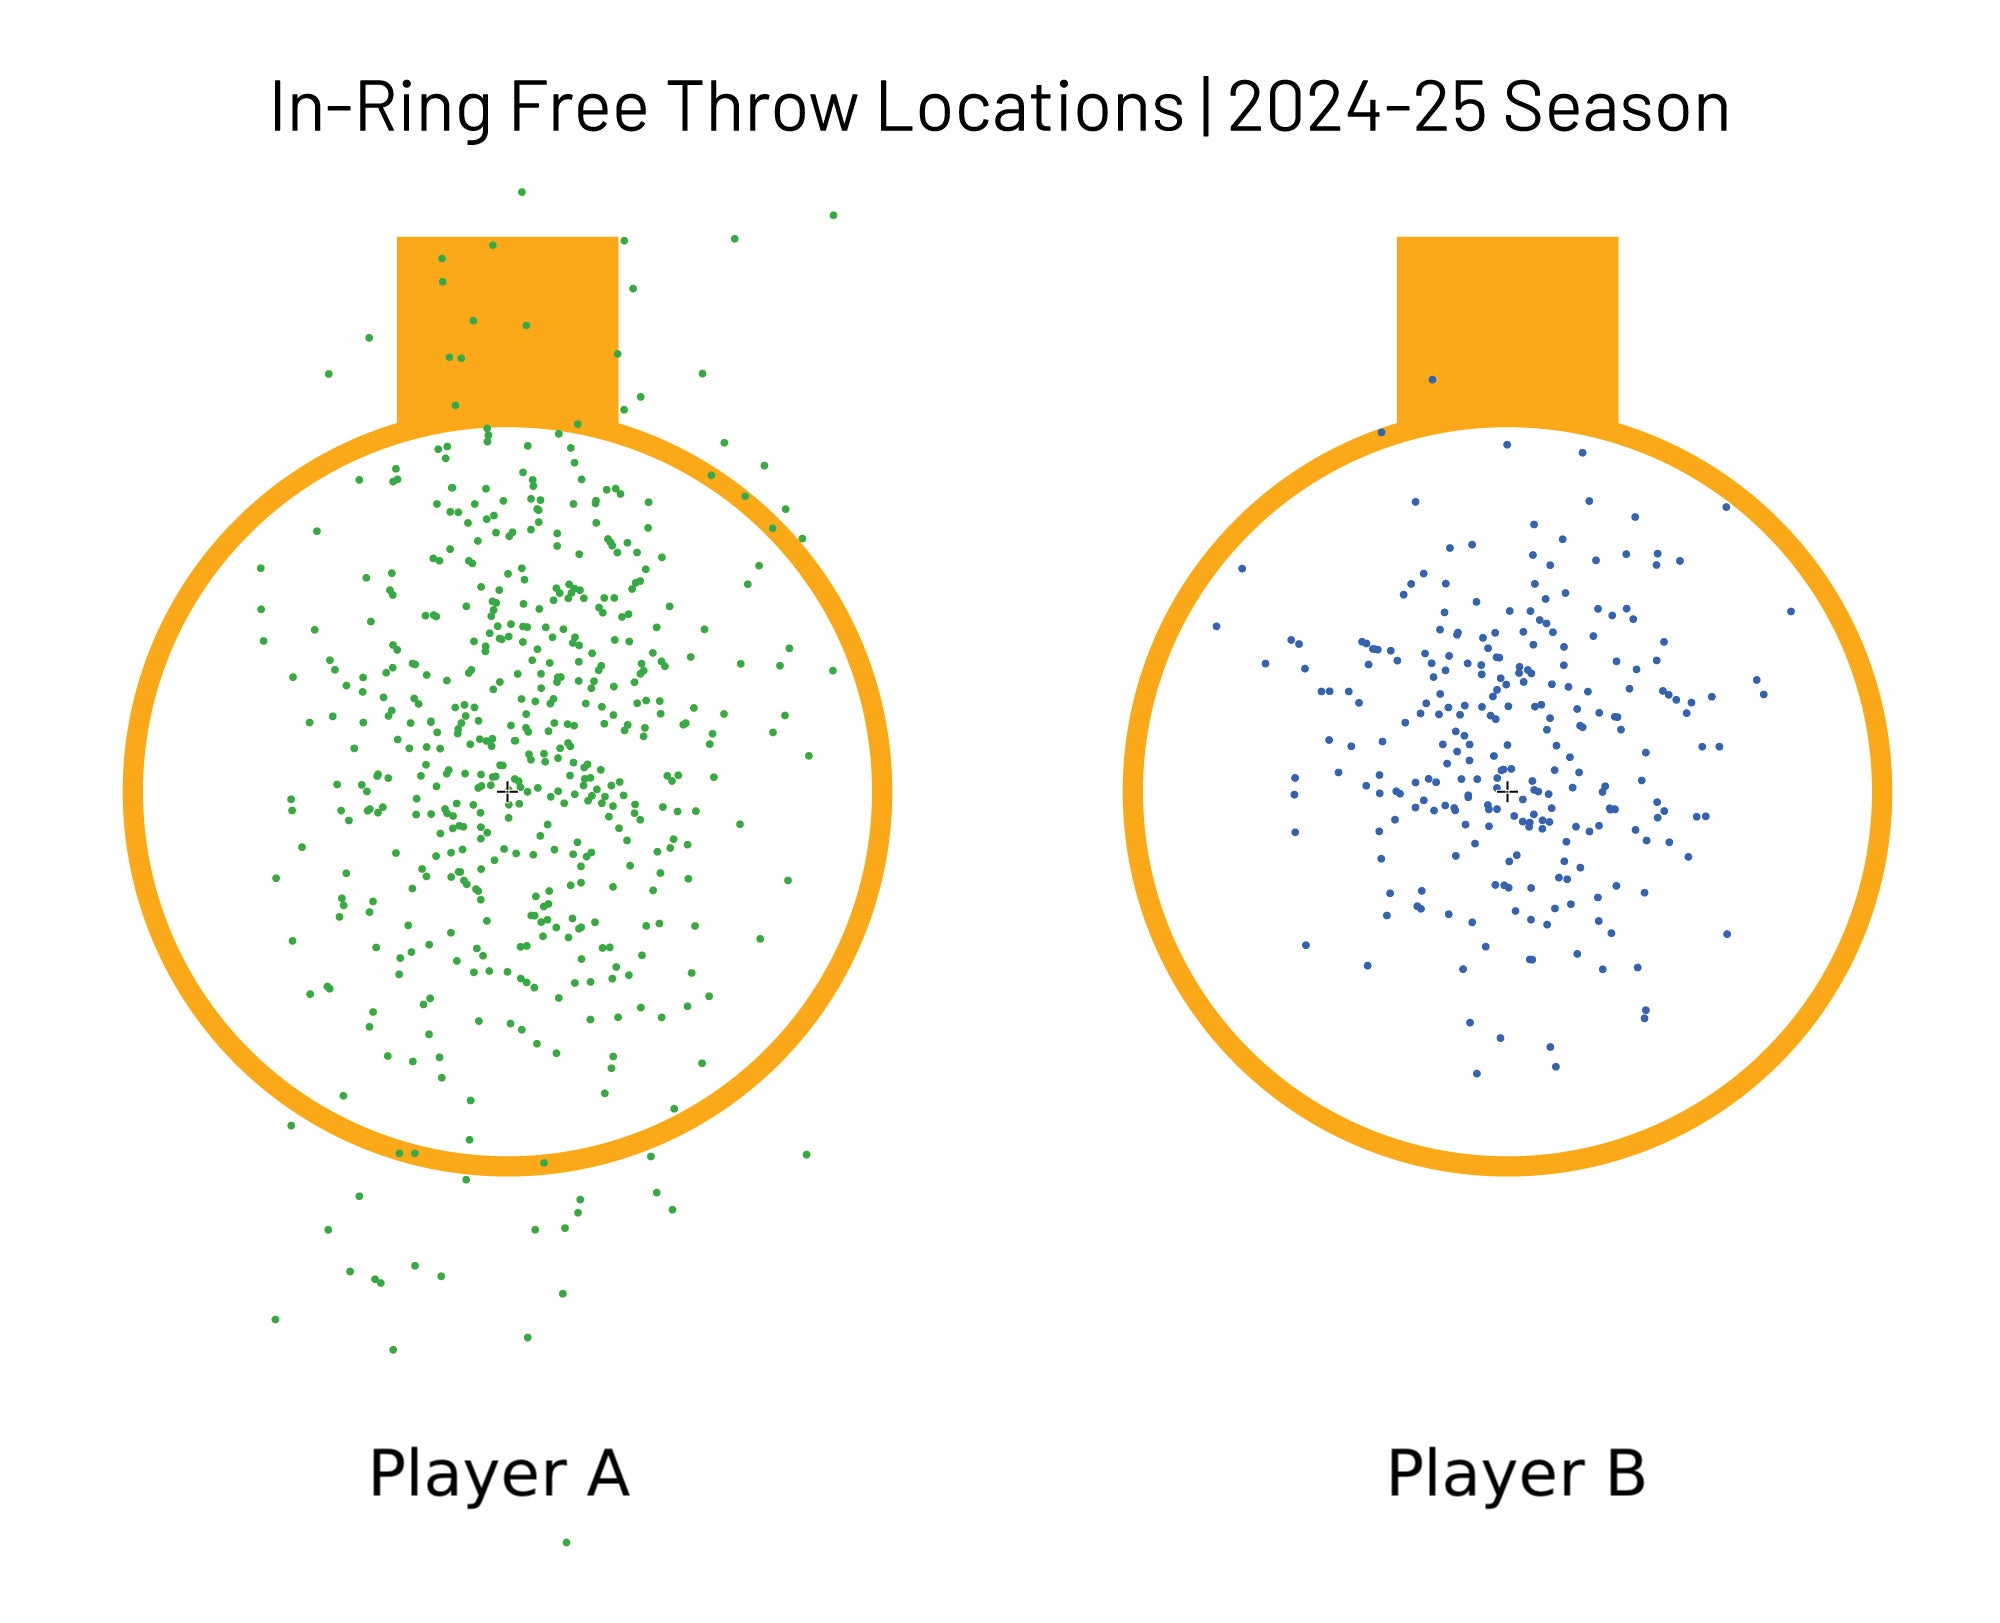
In-ring data for Player A and Player B from the 2024-2025 season. Player B is more accurate and precise (higher command) than Player A. (Figure by Jake McGrath, Vanna Bushong, Michelle Nguyen, Kirk Goldsberry and Amanda Glazer)
The team analyzed nearly 22,000 free throw attempts from 72 NBA players during the 2024-25 season. Instead of recording only whether the ball went in, they measured where it crossed the rim relative to an ideal spot at the center of the basket. A swish counts for more than a make that rattles in, and a near miss is treated differently from an airball. “The goal was to come up with more informative ways to evaluate shooting beyond just makes and misses,” Glazer says.
From those measurements, Glazer’s team built a metric she calls “command.” It combines two elements: how close a player’s shots land to the bullseye, and how consistent the player is from shot to shot. Command turned out to be a better predictor of future free throw percentage than free throw percentage itself. The advantage was greatest in small samples, such as when a team has only a few weeks of data. “You learn more about a player, and you learn it faster,” Glazer says.
Her team also connected command to what happens the instant a shot leaves a player’s hands, including the ball’s launch speed, angle and release position – things a player can work on in training. There is no universal perfect form for free throws, Glazer stresses. A player’s height and natural motion change what the ideal looks like. But she sees her approach yielding recommendations tailored to individual shooters, helping with coaching as well as evaluating talent and room for growth.
The Moment a Player Changes
A second soon-to-be-published paper of Glazer’s turns from basketball to baseball and from a new metric to a new algorithm. Sports statistics usually summarize performance over a game, a month or a season, but those averages can gloss over important moments of transition, Glazer says: “When we look at data across a whole season, we can lose track of when things actually changed.”
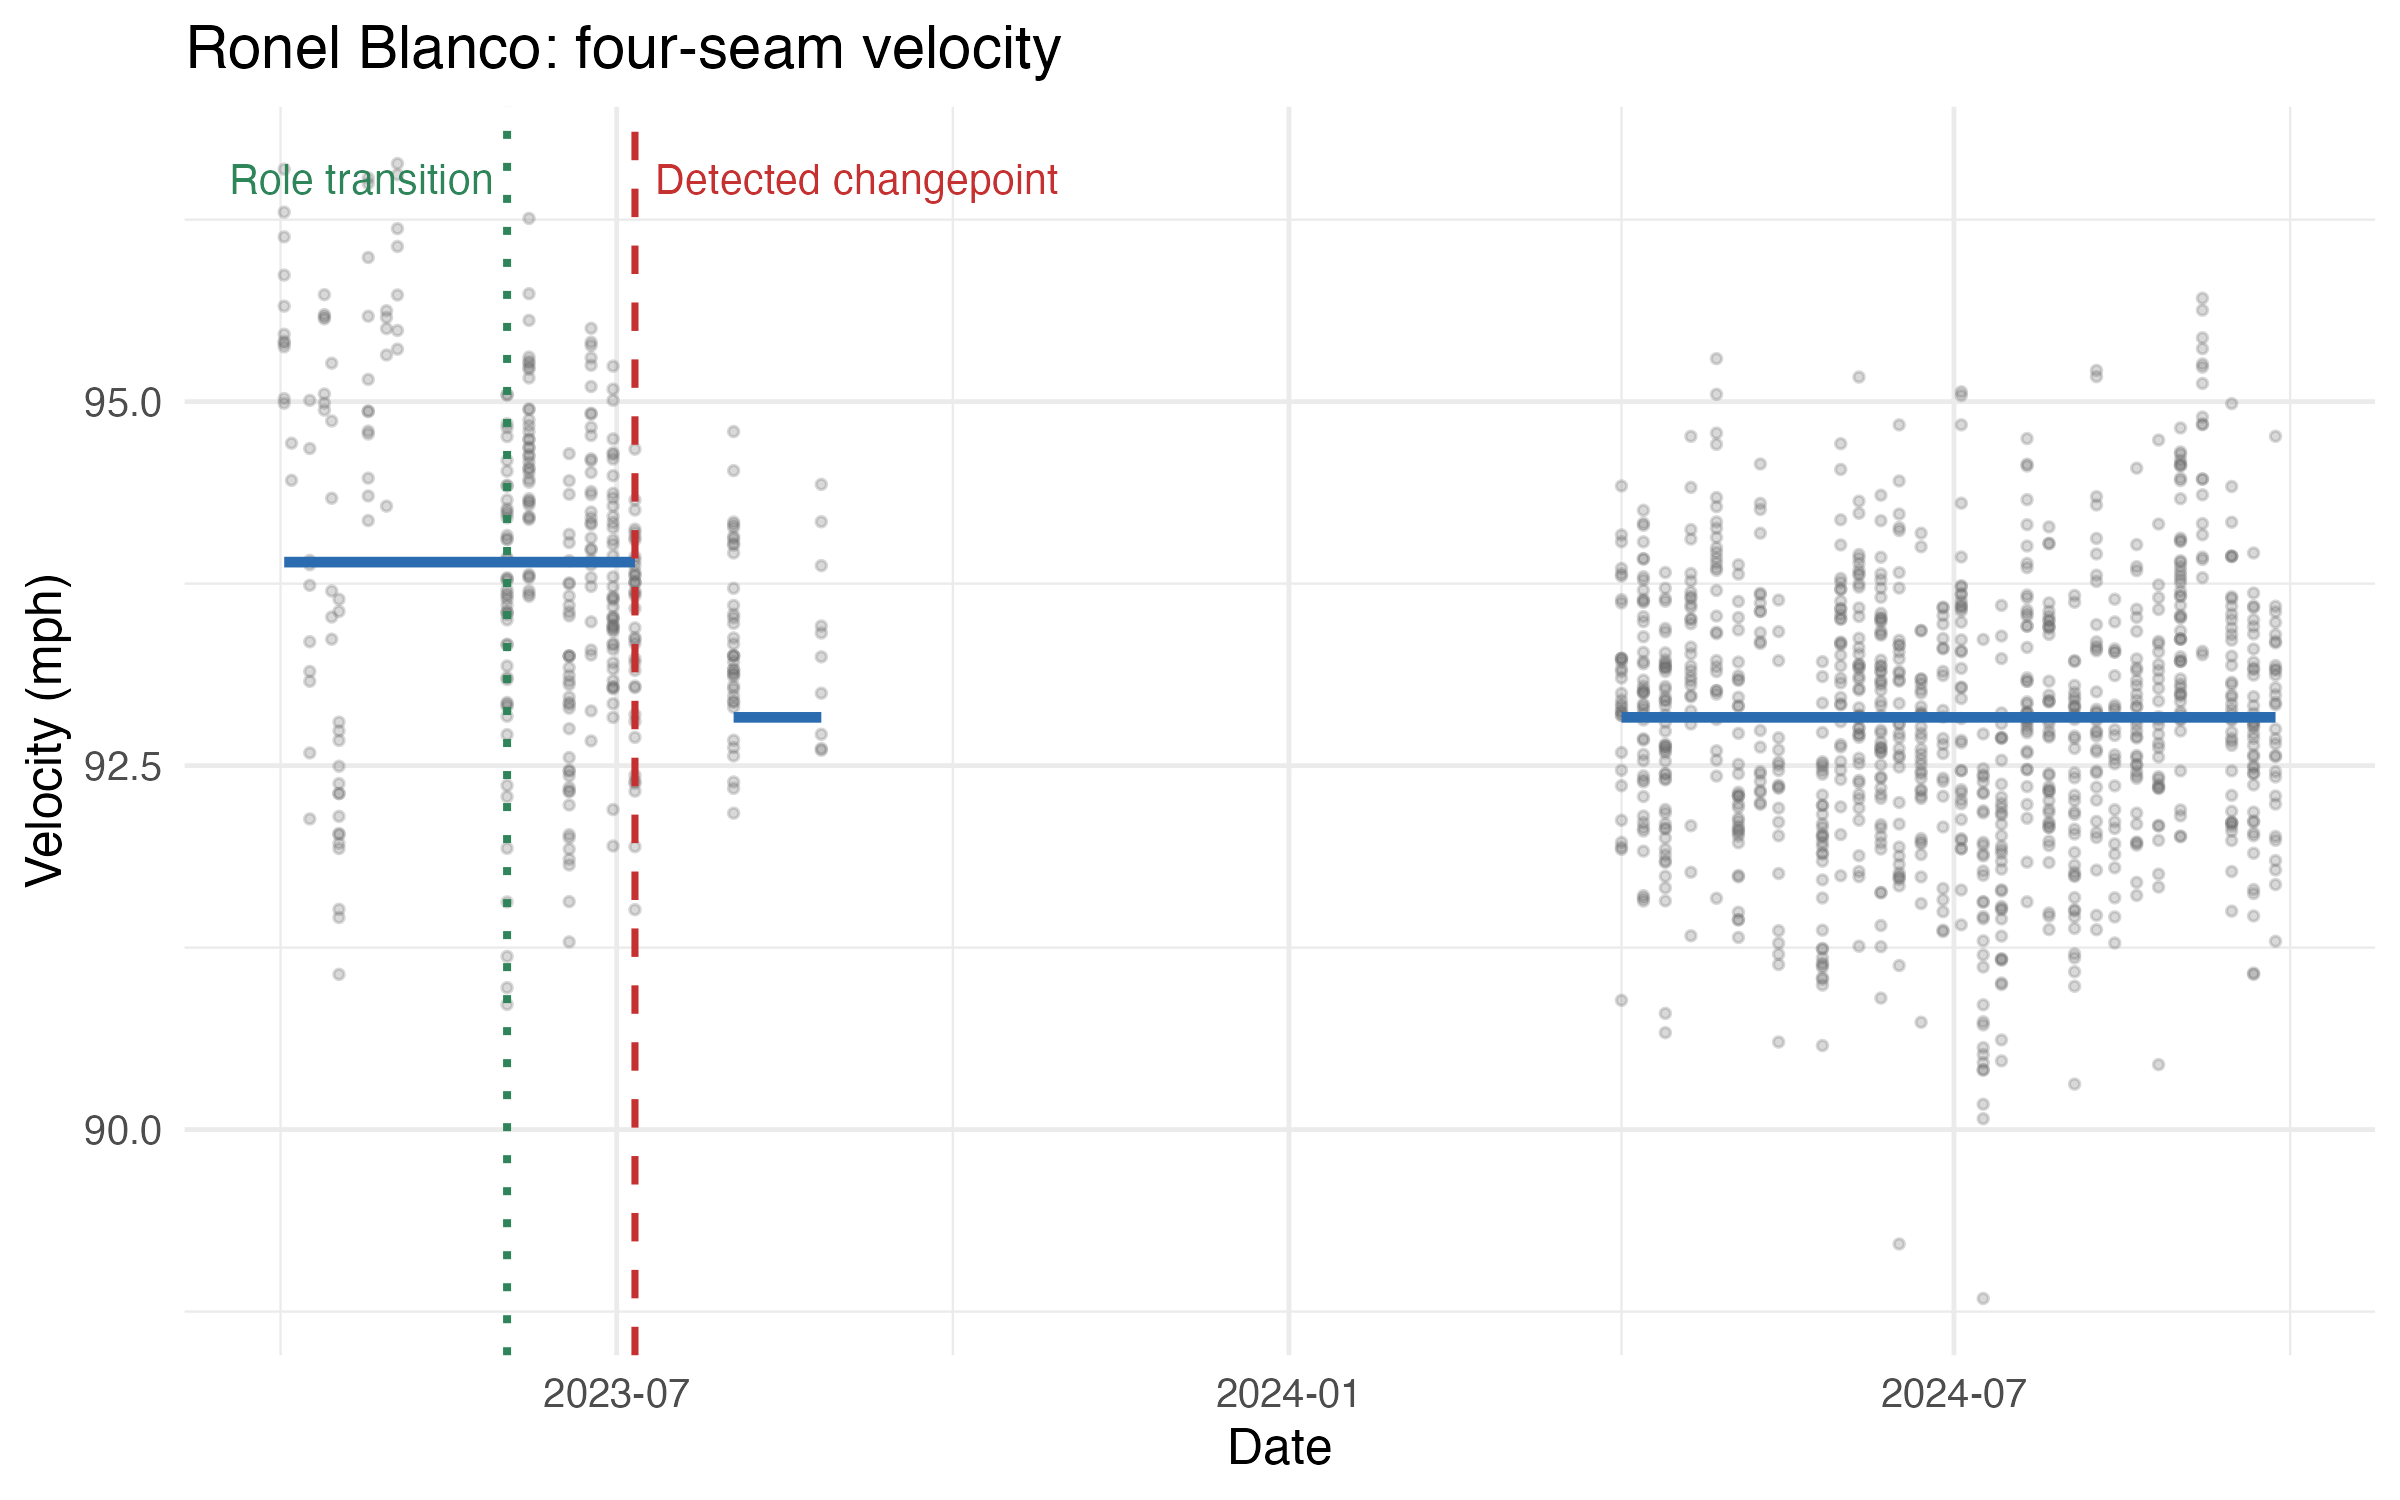
Ronel Blanco’s four-seam fastball velocity dropped after he moved to a starting role in 2023. Glazer’s algorithm identified the shift (red line) shortly after the transition (green line), and the new, lower level held through 2024. (Figure by Amanda Glazer)
Setting out to better pinpoint when shifts happened, such as when a pitcher’s fastball picked up half a mile per hour mid-season, Glazer first reviewed existing approaches but found that they had trouble separating signal from noise. “They were over-flagging players,” she says. “They were basically treating every small change as meaningful, as if players were changing every single day.” Her algorithm adds adjustable settings, so users can screen out small fluctuations and focus on more meaningful shifts. That’s especially important for a metric like fastball velocity, which stabilizes quickly. Because it’s measured so precisely, it’s easy to detect tiny changes that make no real difference on the field. Her goal was an algorithm that’s practically useful, not just statistically sensitive.
Tested on 2023 and 2024 MLB data, including chase rate, whiff rate and fastball velocity, the method proved its value by quickly and correctly identifying meaningful changes in pitchers who moved from the bullpen to the starting rotation, a role change known to affect velocity.
From the Bullpen to the Factory Floor
The practical applications of Glazer’s new algorithm are broad. A front office evaluating free agents or draft-eligible athletes could look for players who improved or declined in recent months, a signal that season-long statistics might miss. Coaches might match her algorithm’s findings against shifts in stance, technique or training regimen.
Glazer is also using the same algorithm to study injury. Many researchers suspect that higher fastball velocity strains the elbow ligament and leads to Tommy John surgery, but cause and effect remains hard to prove. With this new method, she has begun work identifying pitchers whose velocity jumped and comparing their injury rates to those with steadier velocity trajectories. She expects to publish that study soon.
Nor is this approach limited to sports. “These methods apply anywhere you have data collected over time and want to identify when meaningful, practically significant changes occurred,” Glazer says. “Manufacturing, finance, basically anywhere. They’re not specific to baseball or sports.”
Learn more about Glazer’s classroom excellence and the teaching award she shares with two other School of Computing professors.